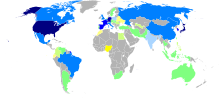
 Motor vehicles produced by country in 2000
 This is a list of countries by motor vehicle production in the 2000s based on Organisation Internationale des Constructeurs d'Automobiles (OICA).
Figures include passenger cars, light commercial vehicles, minibuses, trucks, buses and coaches.
2002
Graphs are unavailable due to technical issues. There is more info on Phabricator and on MediaWiki.org. |
Reference: http://www.oica.net/category/production-statistics/2002-statistics/
2003
Top 20 motor vehicle producing countries 2003 | Motor vehicle production (1000 units) |
| Country | 1000 | 2000 | 3000 | 4000 | 5000 | 6000 | 7000 | 8000 | 9000 | 10000 | 11000 | 12000 | |
 United States United States | | 12115 |
 Japan Japan | | 10286 |
 Germany Germany | | 5507 |
 China China | | 4444 |
 France France | | 3620 |
 South Korea South Korea | | 3178 |
 Spain Spain | | 3030 |
 Canada Canada | | 2553 |
 United Kingdom United Kingdom | | 1846 |
 Brazil Brazil | | 1828 |
 Mexico Mexico | | 1575 |
 Italy Italy | | 1322 |
 Russia Russia | | 1279 |
 India India | | 1162 |
 Belgium Belgium | | 904 |
 Thailand Thailand | | 742 |
 Iran Iran | | 582 |
 Turkey Turkey | | 533 |
 Czech Republic Czech Republic | | 442 |
 South Africa South Africa | | 421 |
| Reference: "World Motor Vehicle Production by Country: 2003–2004" (PDF). OICA. |
| | | | | | | | | | | | | | | | | | | | | | | | | | | | | | | | | | | | | | | | | | | | | | | | | | | | | | | | | | | | | | | | | | | | | | | | | | | | | | | | | | | | | | | | | | | | | | | | | | | | | | | | | | | | | | | | | | | | | | | | | | | | | | | | | | | |
Graphs are unavailable due to technical issues. There is more info on Phabricator and on MediaWiki.org. |
Reference: "World Motor Vehicle Production by Country: 2003–2004" (PDF). OICA.
2004
2005
2006
2007
2008
Top 20 motor vehicle producing countries 2008 | Motor vehicle production (units) |
| Country | 1,000,000 | 2,000,000 | 3,000,000 | 4,000,000 | 5,000,000 | 6,000,000 | 7,000,000 | 8,000,000 | 9,000,000 | 10,000,000 | 11,000,000 | 12,000,000 |
| Japan | 11,563,629 | |
| China | 9,345,101 | |
| United States | 8,705,239 | |
| Germany | 6,040,582 | |
| South Korea | 3,806,682 | |
| Brazil | 3,220,475 | |
| France | 2,568,978 | |
| Spain | 2,541,644 | |
| India | 2,314,662 | |
| Mexico | 2,191,230 | |
| Canada | 2,077,589 | |
| Russia | 1,790,301 | |
| UK | 1,649,515 | |
| Thailand | 1,393,742 | |
| Turkey | 1,147,110 | |
| Iran | 1,051,430 | |
| Italy | 1,023,774 | |
 Poland Poland | 950,908 | |
| Czech Rep. | 945,822 | |
| Belgium | 724,498 | |
| Reference: "Production Statistics". OICA. Retrieved 2009-06-24. |
| | | | | | | | | | | | | | | | | | | | | | | | | | | | | | | | | | | | | | | | | | | | | | | | | | | | | | | | | | | | | | | | | | | | | | | | | | | | | | | | | | | | | | | | | | | | | | | | | | | | | | | | | | | | | | | | | | | | | | | | | |
2009
Top 20 motor vehicle producing countries 2009 | Motor vehicle production (units) |
| Country | 1,000,000 | 2,000,000 | 3,000,000 | 4,000,000 | 5,000,000 | 6,000,000 | 7,000,000 | 8,000,000 | 9,000,000 | 10,000,000 | 11,000,000 | 12,000,000 | 13,000,000 | 14,000,000 |
| China | 13,790,994 | |
| Japan | 7,934,516 | |
| United States | 5,711,823 | |
| Germany | 5,209,857 | |
| South Korea | 3,512,916 | |
| Brazil | 3,182,617 | |
| India | 2,632,694 | |
| Spain | 2,170,078 | |
| France | 2,049,762 | |
| Mexico | 1,557,290 | |
| Canada | 1,489,651 | |
| Iran | 1,395,421 | |
| UK | 1,090,139 | |
| Czech Rep. | 974,569 | |
| Thailand | 968,305 | |
| Poland | 879,186 | |
| Turkey | 869,605 | |
| Italy | 843,239 | |
| Russia | 722,431 | |
| Belgium | 522,810 | |
| Reference: "Production Statistics". OICA. Retrieved 2010-04-26. |
| | | | | | | | | | | | | | | | | | | | | | | | | | | | | | | | | | | | | | | | | | | | | | | | | | | | | | | | | | | | | | | | | | | | | | | | | | | | | | | | | | | | | | | | | | | | | | | | | | | | | | | | | | | | | | | | | | | | | | | | | | | | | | | | | | | | | | | | | | | | | |
See also

 United States
  Japan
Japan  Germany
  China
China  France
  South Korea
  Spain
Spain  Canada
  United Kingdom
  Brazil
  Mexico
  Italy
Italy  Russia
  India
India  Belgium
  Thailand
  Iran
Iran  Turkey
  Czech Republic
  South Africa
  Poland


